Beyond NDVI: Grape Maturity Maps for Better Quality Wine
2-minute read
To achieve the desired quality of wine, grapes need to be harvested at a specific maturity level. A key determinant of maturity is grape sugar levels. In simple terms, sugar levels at the time of harvest determine the alcohol content of the wine produced, but it goes beyond that to affect the characteristics and temperament of the wine. Predicting when grapes reach the desired sugar content is, thus, a crucial point connecting the vineyard and the winery. All viticulturists know, however, that grapes do not mature homogeneously and there is likely to be variability in grape sugar levels within blocks at the time of harvest.
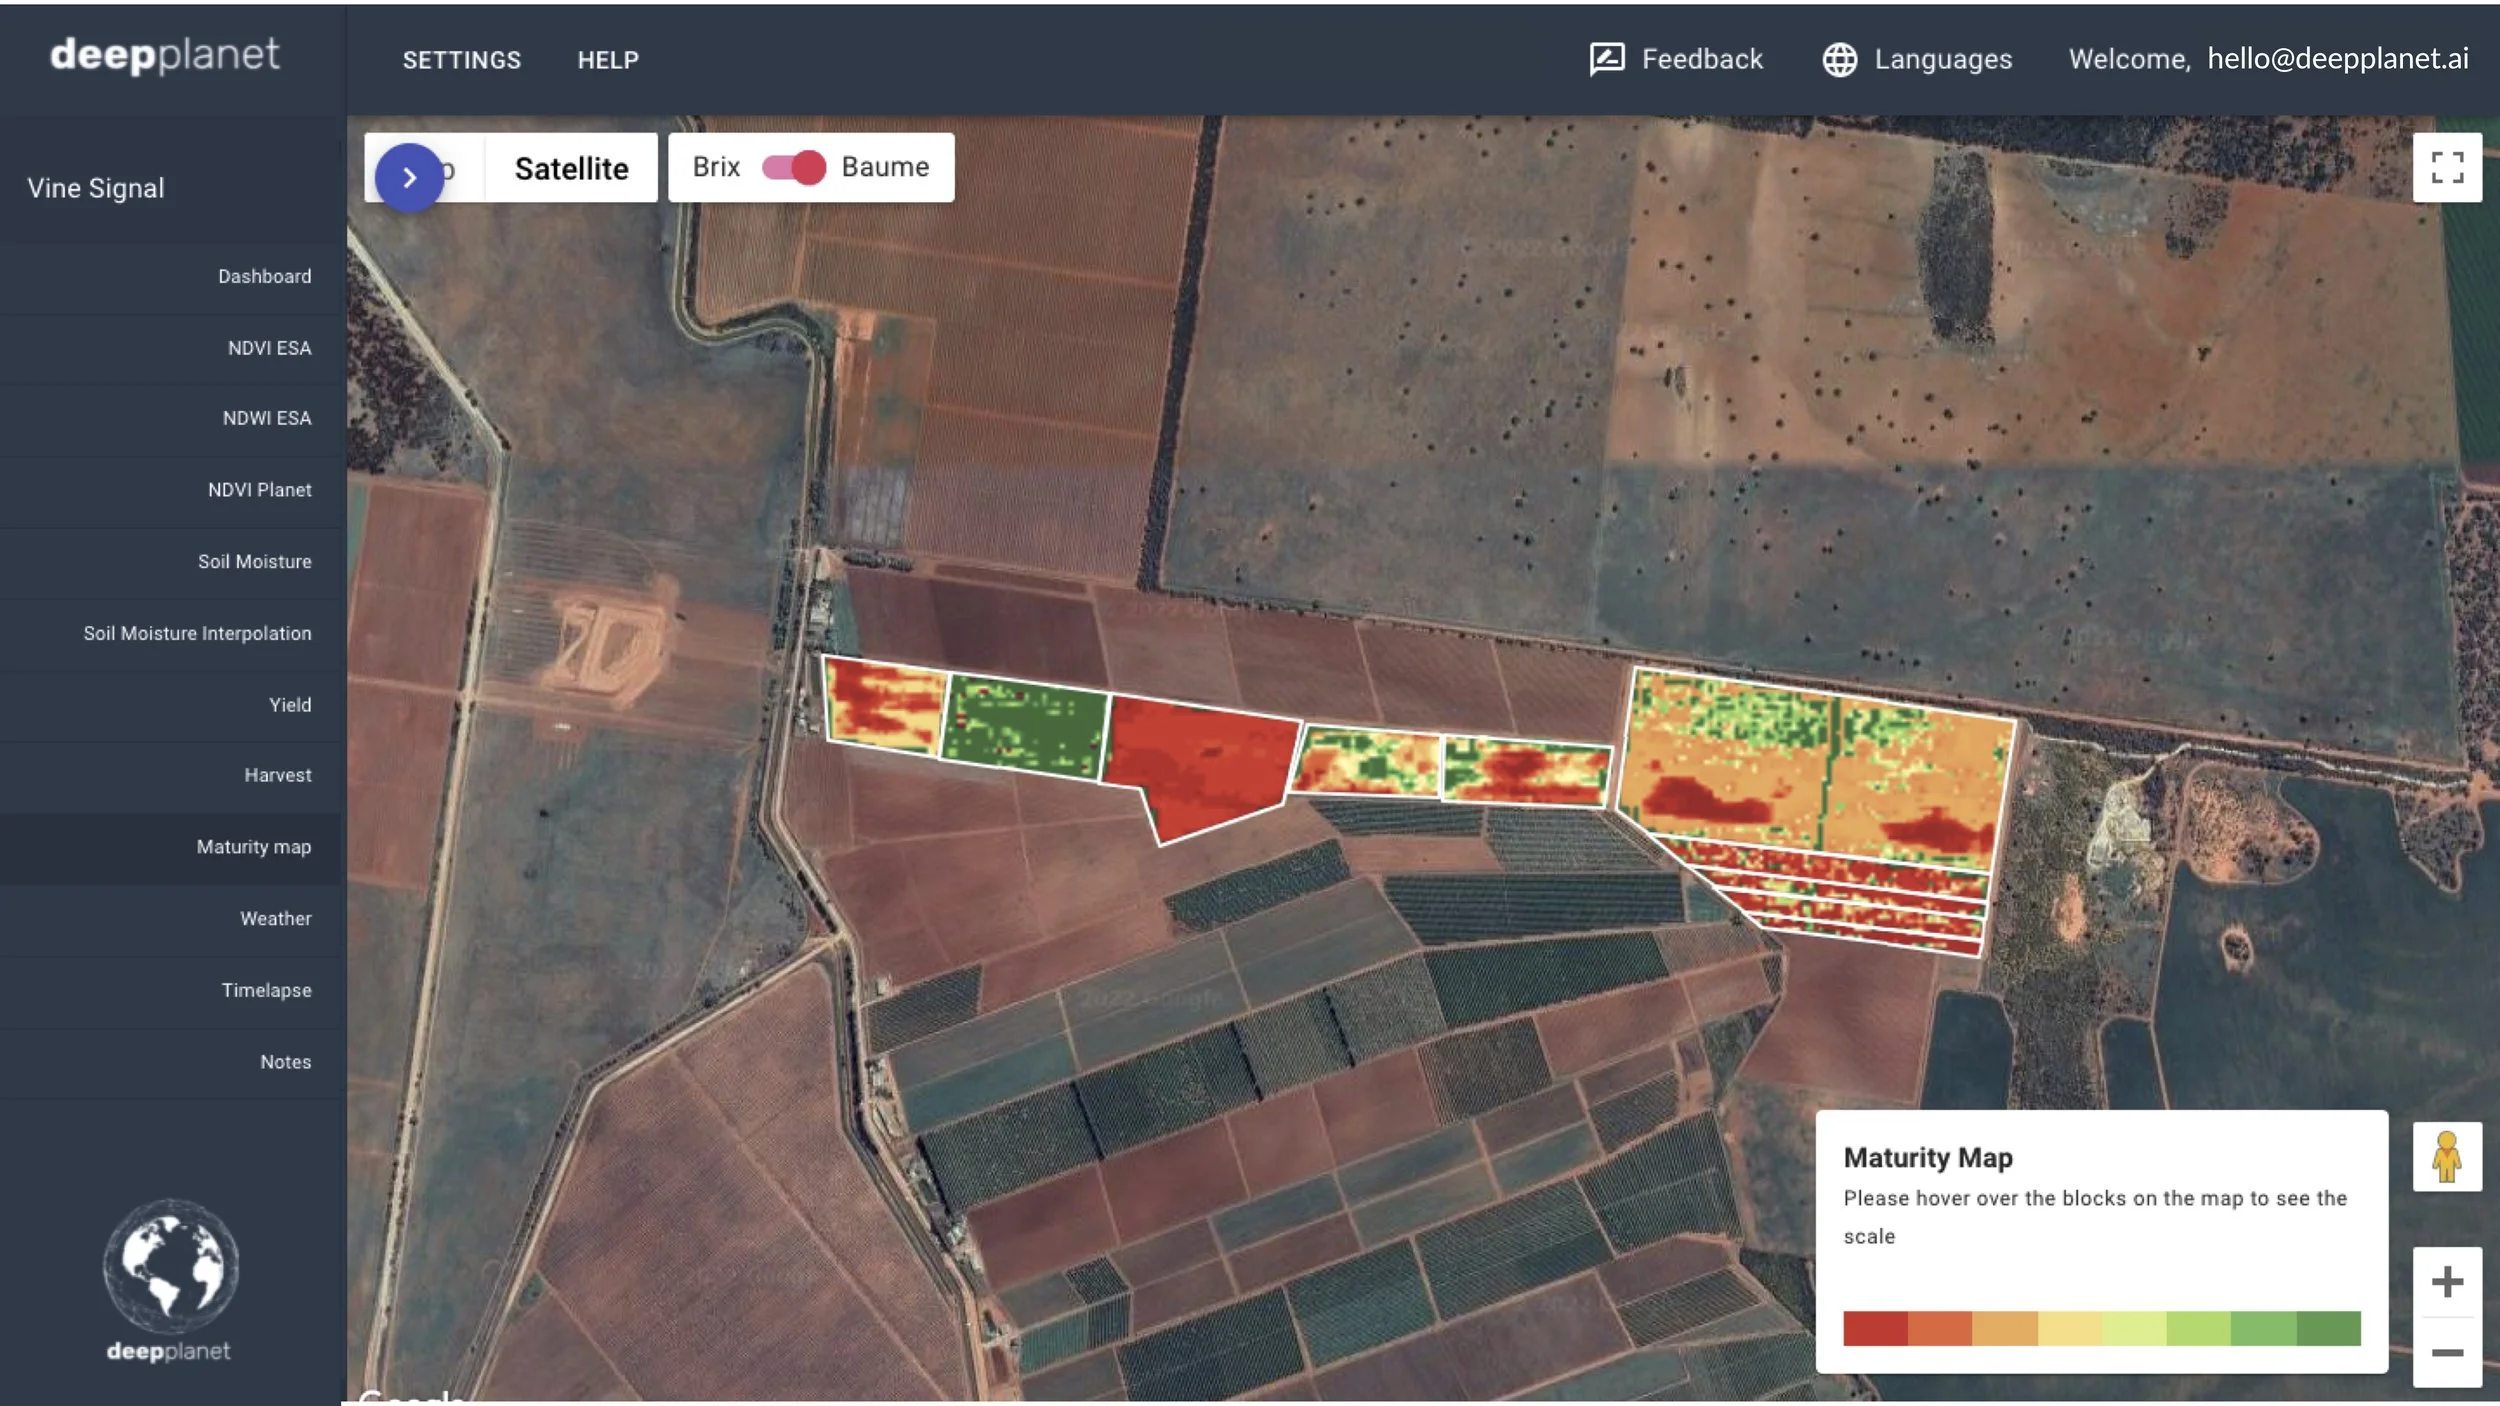
Maturity Map showing variation in sugar levels within the block © Deep Planet
To address this variability, some growers use the method of split picking or differential harvesting. This means different parts of a block are harvested at different times based on when grapes hit desired maturity levels. As a result, producers can gain $2-$20 value per bottle. However, split picking is not an easy task because it requires knowing where and to what extent there is variability within blocks.
Grape Maturity Maps, produced by combining satellite imagery and AI, visualize maturity variation and give growers guidance to allow differential harvesting.
Split picking (differential harvesting) and its challenges
Split picking allows the viticulturist and the winemaker to have better control over the quality of grapes intended to be used in each bottle of wine. The value of this is that quality control happens already in the vineyard, so production value increases at the stage of wine production. However, split picking at scale is a rather challenging task:
Resource-intensive: Manually inspecting each block to identify maturity variation with conventional methods of measuring sugar levels is highly labour-intensive and time-consuming.
Biased: Choosing where to sample for measuring maturity inherently introduces human bias. Therefore, not all variation within blocks will be revealed and accounted for.
Difficult to scale: As the size of the vineyard increases, the costs of split picking become greater, so it becomes increasingly difficult and its value decreases.
Grape Maturity Maps make split picking viable at scale
Grape Maturity Maps, developed by Deep Planet, like the one shown above, make split picking possible at scale and hence make a huge impact on wine quality. These maps are produced using satellite imagery, proprietary machine learning algorithms, historical and ground data. They allow growers and wine producers to:
Manage variability within blocks at a better resolution without the need to increase resource inputs. This gives the viticulturist and the winemaker so much more insight than a simple average Brix/Baume per block.
Reduce bias associated with the choice of sampling sites.
Improve grape quality with split picking at scale as resource inputs do not have to increase exponentially which is the case with manual measurements of sugar levels.
Deep Planet’s Maturity Maps is making a positive impact on growers this season, with an estimated $2-$20 value-add per bottle of wine produced. It gives growers better control over the quality of grapes grown in each block and hence helps make confident supply planning decisions for each bottle of wine.
If you’d like to understand the sugar level variation in your vineyard and insights to improve your production efficiency, sign up for a VineSignal Free Trial below and reach out to us at hello@deepplanet.ai